
EV Industry Size
EV market stats indicate that the total market value for electric cars is close to 280 billion USD as at the end of 2021.
Electric Vehicle Production
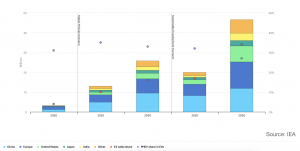
In 2021, more than 16.5 million electric cars were being driven globally, which had tripled since 2018.
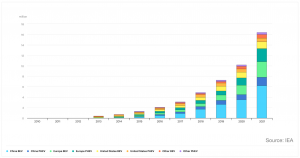
Of all the countries worldwide, China was the leading EV manufacturer statistically speaking. They produced almost 8 million EVs in 2021. Europe was the second largest manufacturer, with about 6 million EVs.
The model type more prominent than others in all global markets was the SUV, which had the most available models in China, Europe, and the US. The second most popular model type overall was the medium car.
In China, there was a higher number of small car models compared to large cars and crossovers than in Europe and the US.
What Percentage of Vehicles are Electric in the World?
The Hedges Company Automotive Research team calculates there are about 1.446 billion cars in the world as of 2022.
Since the number of EVs likely falls a few million over 16.5 million (the sales of 2021), the global percentage of electric cars in the world is only about 1.2 – 1.4% of all vehicles.
Charging Station Locations
The Alternative Fuel Data Center shows over 61,000 public electric vehicle charging stations in the US and Canada. Around 53,000 of those stations were in the US.
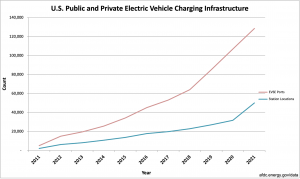
Comparatively, the cumulative number of EVSE (electric vehicle supply equipment) ports comes to roughly 130,000 ports. That’s an average of 2.6 ports per station.
In 2011, there were only 2,100 charging stations. From 2011 to 2019, stations steadily grew, with about 2,000 to 4,000 new ones introduced yearly.
In 2020 this increase went up to about 5,000, and in 2021, there was a massive leap of almost 20,000 new stations.
Overall, there has been a 2383.5% increase in EV charging stations over the past ten years.
US Public and Private Alternative Fueling Stations by Fuel Type
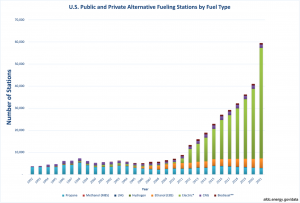
As made evident by the AFDC graph below, there have been more electric charging stations than any other alternative fueling station since 2012.
***Abbreviation meanings:
CNG: compressed natural gas
E85: 85% ethanol, 15% gasoline
LNG: liquefied natural gas
M85: 85% methanol, 15% gasoline
The biggest jumps in electric power stations were from 2010 to 2011 and from 2011 to 2012 (over triple each year). Afterward, there was a steady rate of exponential growth.
Out of the nine alternative fueling stations, only four existed in 1992. Since then, four more have been introduced, including electric, while methanol stations have been completely eliminated.
From 1992 to 2021, there was an incremental increase in alternative fueling stations by about 1614.1%, with the vast majority resulting from electric charging stations.
Global EV Sales for 2023
According to the IEA In 2023, nearly one in five cars sold was electric, with electric car sales nearing 14 million. This figure represented a 35% year-on-year increase from 2022 and brought the total number of electric cars on the road to 40 million, closely aligning with the forecast from the 2023 edition of the Global EV Outlook (GEVO-2023). The majority of these sales, 95%, occurred in China, Europe, and the United States. Over 250,000 new electric cars were registered weekly, surpassing the annual total from just a decade earlier in 2013. Electric cars accounted for approximately 18% of all cars sold in 2023, up from 14% in 2022 and only 2% in 2018. Battery electric cars made up 70% of the electric car stock, indicating robust growth as the market matures.
April marked the highest increase in sales from 2020 to 2021 with a 247% increase. December would mark a 58% increase in sales from 2020 and reach almost 1 million total sold EVs.
71% of these sales would be BEV (battery electric vehicles), and 29% would be plug-in hybrids.
Ranking the electric car sales worldwide in 2021 by brand would put Tesla on top, followed by VW Group and BYD. From the previous year, Tesla saw an 87% increase, VW saw an 80% increase, and BYD saw an astounding 225% increase.
Of all BEV and PHEV models, the Tesla Model 3 (a BEV model) had the highest volume of global deliveries.
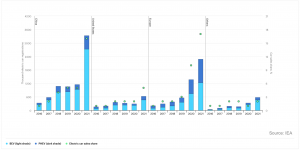
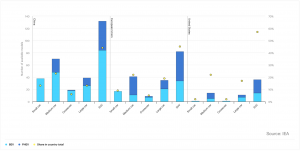
As indicated by the above chart, sales have more than doubled in China between 2020 and 2021. Seeing as how they have the highest electric vehicle sales per year and are the leading manufacturers in the industry, this growth is completely probable.
The second biggest player in the industry was Europe. While they did not see quite as many car registrations or as high of a sales growth as China, they did experience a large rise in sales.
Even though the US is lagging behind other global EV markets, it has seen a huge amount of growth from 2020 to 2021.
There is a much higher EV sales share number in the US and Europe than there are cars registered. Alternatively, in China, there are more cars registered than there are sales shares.
EV Sales in the US
Although the US doesn’t have as big of a market for EVs as China or Europe, production and sales are still on the rise. The following statistics were retrieved from the Argonne National Laboratory:
HEV Sales
The 18,600 cars and 44,766 LTs (66,366 total HEV sales) sold in July 2022 were down by 14.7% when compared to the July of 2021.
The majority of these HEVs were sold by Toyota, accounting for 56.7% of sales. On the other hand, Prius only represented roughly 1.7% of all US HEV sales during the month. This marked a 73.7% decrease from the previous year for Prius.
Plug-in Vehicle Sales
In the same month (July 2022), 79,325 plug-in vehicles were sold in the United States. This number was comprised of 12,919 PHEVs and 66,406 BEVs.
The total sales of PEVs were up 37.5% from 2021 and made up 7.02% of all light-duty vehicles sold during the month.
The total number of PHEVs and BEVs sold in 2022 amounted to 501,747 units sold from January to July.
The total number of electric cars in the US, including all plug-in vehicles sold since 2010, is 2,849,502.
Hydrogen Fuel Cell Electric Vehicle (FCEV) Sales
Of the 1,925 FCEVs in 2022, 91 of them were sold in July.
Only 14,207 FCEVs have been sold between 2014 and 2022 in the US.
EV Market Share by State
The following chart indicates the volume of EVs in each state by the date December 31, 2021. The highest number of registered EVs was in California, which had 39% of the nation’s overall vehicles. Next up is Florida, with the second most EVs in the US, and Texas, with the third most EVs in the US. The state with the lowest number of EVs was North Dakota.
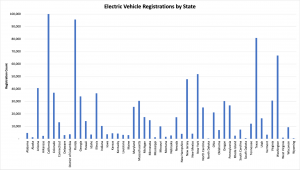
The graph caps out at 100,000 EVs, but the state of California actually had roughly 563,070 registered vehicles. The following chat contains the actual numbers of each state.
EV Sales in China
From 2020 to 2021, China saw a 155% sales increase in EVs. This resulted in a 4.7% increase in their total market sales.
Of the 6.75 million BEVs and PHEVs sold in 2021, about 3.4 million of them were sold in China. Comparatively, China sold about 1.4 million the prior year.
EV Sales in Europe
With 690k vehicles sold in 2021, Germany has the highest number of EVs sold in Europe and the second highest number of EVs sold in the world (second to China). The UK has the second highest number of EVs sold, with 326k.
US EV Sales Percentages of Total Vehicle Sales By Brand
According to reports driven by Experian, Tesla is the leading EV sales brand in the US, holding 69.95% of market shares.
Nissan had the second highest percentage of market shares with 8.51%, and Chevrolet was third with 7.15%.
Tesla has the highest market share percentage in all states except for Alaska, where Nissan holds 40% of the state’s market shares.
Electric Vehicle Sales Market Share and Forecast
Regarding IEA statistics, the global market share for electric vehicles moved up from 4.11% in 2020 to 8.57% in 2021. This is out of 6.7 million registered vehicles.
This number has increased exponentially since 2010 when electric cars only held about .01% of the market.
As global efforts are pushing toward more renewable sources of energy, this trending growth for EVs can expect to continue upward in the coming years.
Electric Vehicle Market Share by Company
According to a 2022 InsideEVs Q1 report summary, Tesla has the highest global electric vehicles market share ranking with 15.5% (310,411 units sold), followed not far behind by BYD, which has a 14.3% market share ranking. This includes BEVs and PHEVS.
For BEVs only, Tesla market share is a global share of 21.6%. SAIC has 10.7% of these global EV market shares, and BYD has 10%.
Electric Vehicle Market Forecast
For the global EV market share by company, a Mordor Intelligence industry report predicts that the global revenue for electric cars will reach 1 trillion USD by 2026. This would be a 357% increase from the 2022 market value of 280 billion.
Furthermore, IHS Market has calculated that over 50% of all EVs will be produced in Asia, 43.8% of which will be from China. It is believed that Japanese and Korean manufacturers will be slightly over 11% of the industry.
Also, in 2030, it is predicted that there will be over 25 million EVs in operation (source: evadoption.com) compared to 2022, which will have approximately 3 million by the end of the year, clearly displaying the growth of electric vehicles.
EV Growth Projections
Below you can find some strong insights in regards to EV growth projections.
What Percentage of Cars Will Be EV by 2025?
Predictions suggest that 23% of new vehicles sold will be EV.
What Percentage of Cars Will Be EV by 2030?
As per the Net Zero Scenario, the global EV stock will reach 350 million vehicles in 2030. This figure does not include two and three-wheelers. Thus EVs will form 20% of the total volume of cars in the world. In 2030, there will be over 65 million vehicles sold, which will be a sales share of almost 60%.
Overall, the electric vehicle forecast for 2030 expects to see a steady slope of growth, with 33%, as global efforts attempt to make the switch to more economical fueling. These efforts are imperative to reducing overall greenhouse gas emissions and converting the world to a more sustainable source of energy.
Conclusion
With China in the lead as the country with the highest market share of EVs and Tesla as the leading manufacturer, electric vehicle data shows exponential growth in the past five years. Since their rise in popularity starting in 2010, they have quickly become the number one alternative fueling method for cars. Thus, the electric vehicle outlook is strong, as predictions say that 33% of vehicles sold will eventually be EV.
Despite America lagging behind China and Europe in EV sales and manufacturing, there has still been a high degree of development in 2020 and 2021 since the percentage of electric cars globally is 1.2 – 1.4% of all vehicles, so electric vehicle projections are favorable.